APIs
APIs are upstream endpoints exposed through the API Gateway. They can either be made directly accessible via the reverse proxy or execute a custom processing pipeline before returning a response.
API overview
The API overview page shows APIs which are exposed over the Gateway.
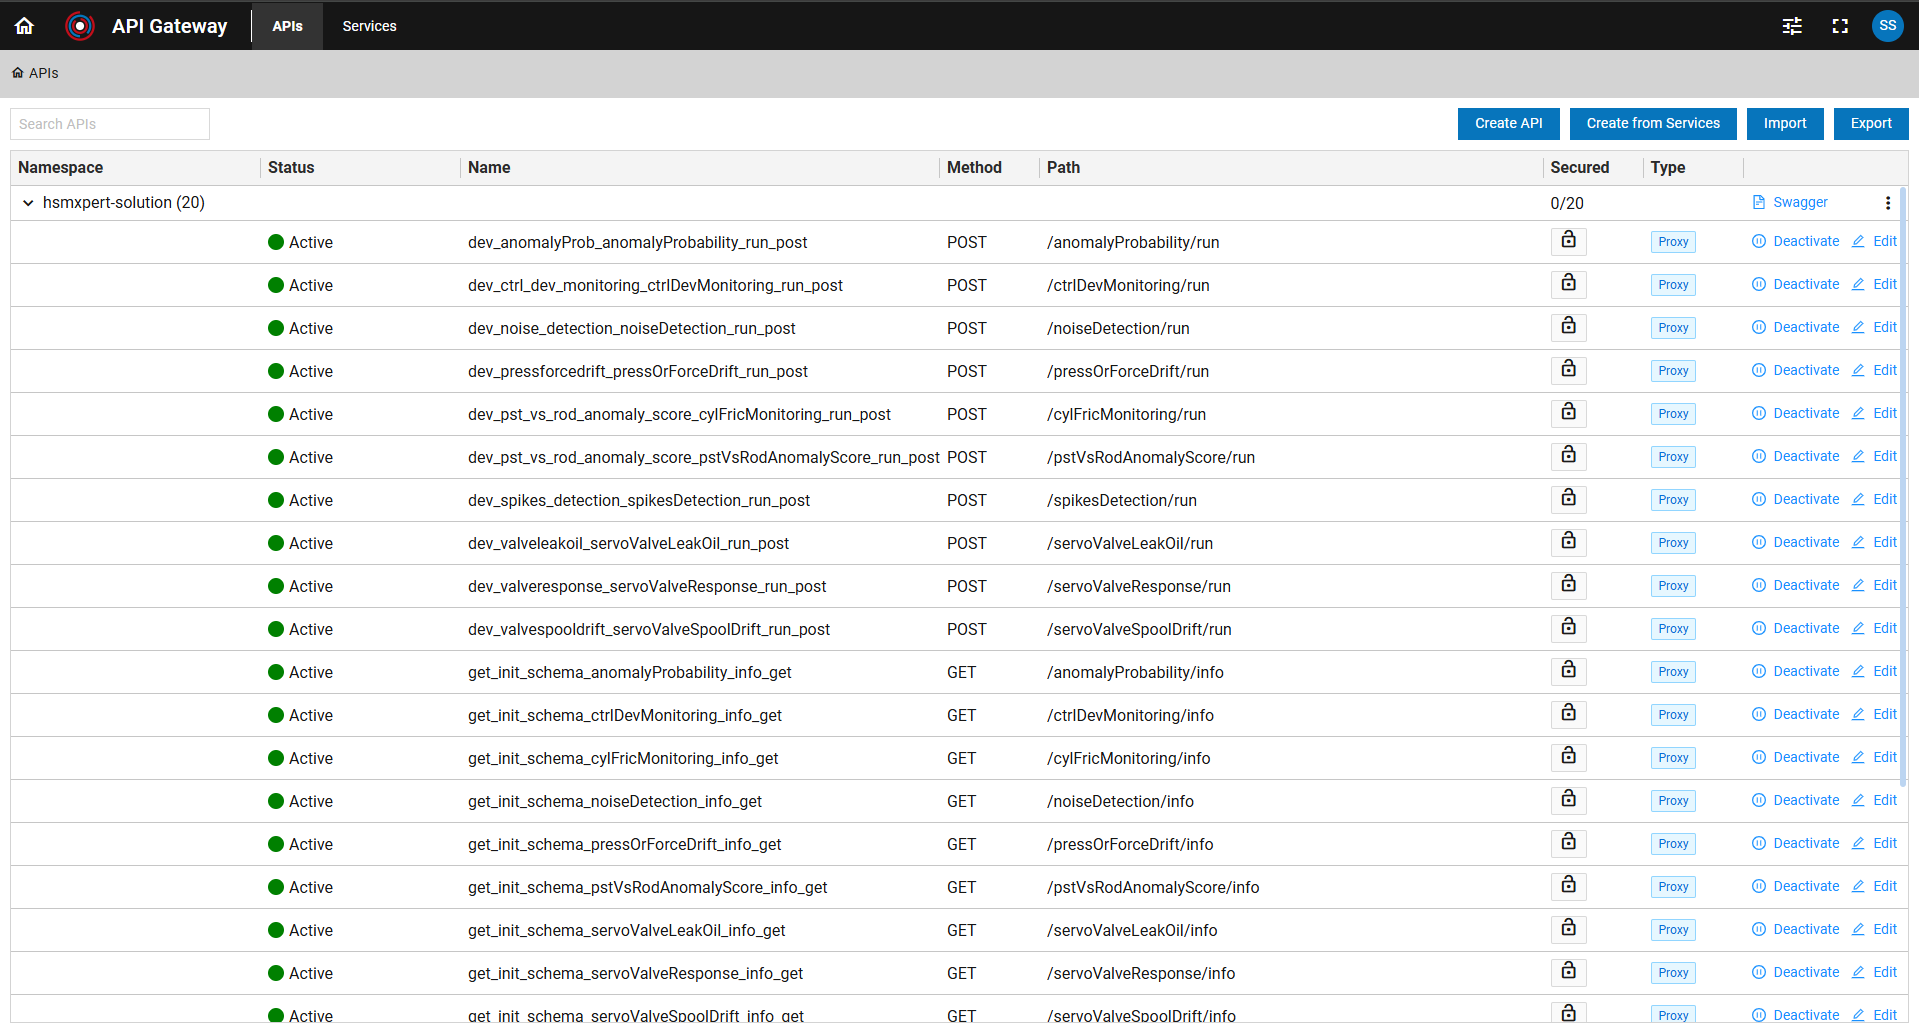
Namespace Level Information
- Namespace: Provided when creating an upstream API.
- Secured: Displays the number of endpoints in this namespace that are protected by API Gateway authorization feature.
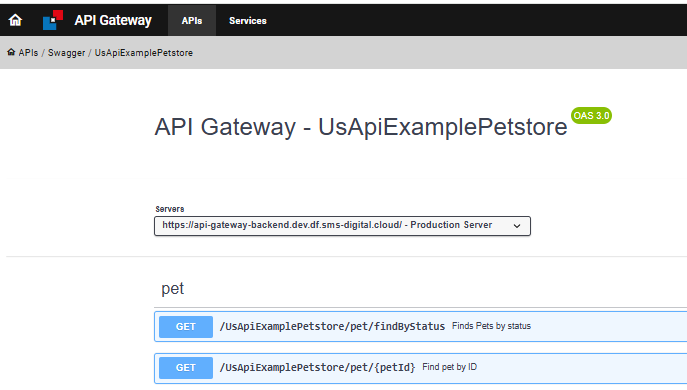
- Swagger Link: Opens the Swagger UI for endpoint exploration. See below.
- Overflow Menu "⋮":
- Delete: Delete complete namespace
- Authorization: Manage Keycloak client and role assignments for all endpoints within the namespace. See Authorization for details.
- Documents: Upload, view, download, or delete OpenAPI documents (except the original import document).
Endpoint Level Information
- Status: Indicates if the endpoint is active (green) or inactive (red). Toggle using the Activate/Deactivate button.
- Name: Endpoint name.
- Method: HTTP method.
- Path: Route for the endpoint.
- Secured: Indicates whether the endpoint is protected by API Gateway authorization features.
- Type: Specifies whether the endpoint making use of the reverse proxy or if a internal pipeline is executed.
- Activate/Deactivate: Toggle endpoint status.
- Edit: Opens the edit dialog. See Processing and Mapping.
Creating APIs
Create API

Opens the dialog to create a new upstream API endpoint from scratch. For details, see Processing and Mapping.
Create from Services

Opens the dialog to create upstream endpoints based on imported downstream endpoints.
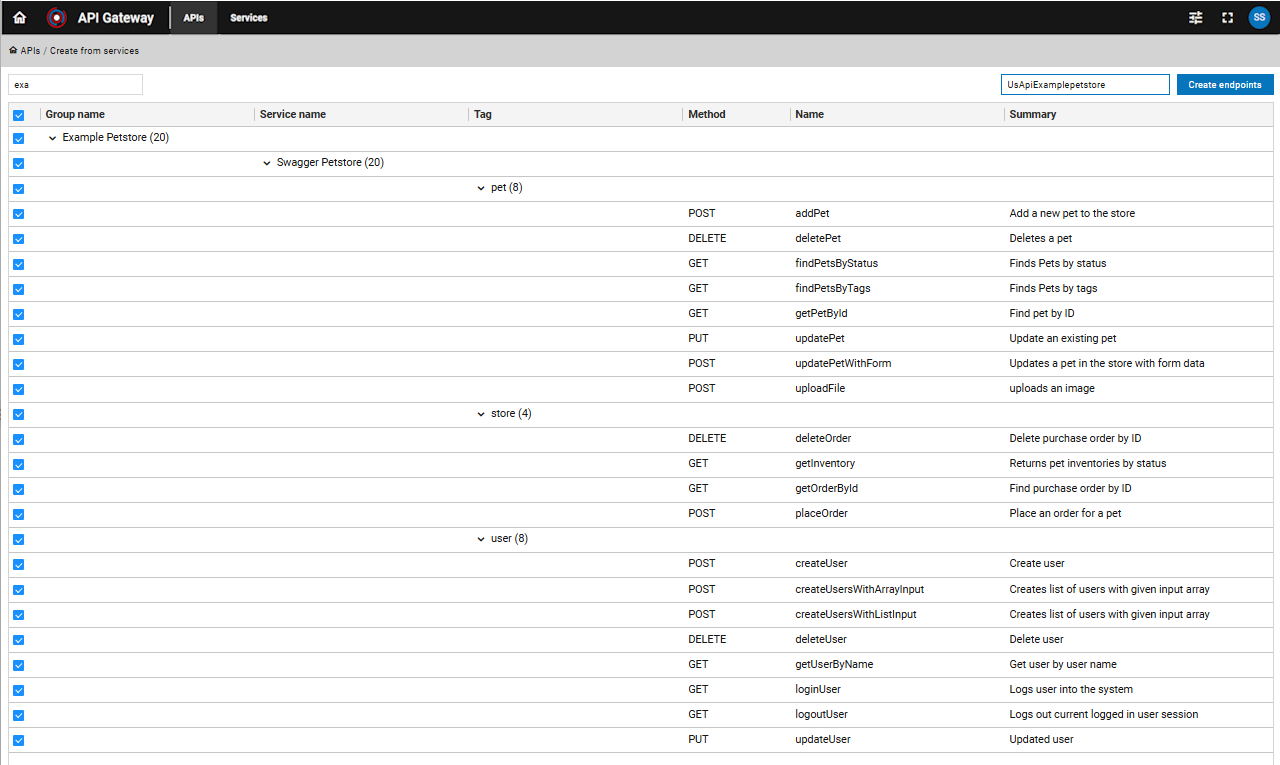
Steps:
- Specify the Namespace (no spaces, used as entry path for the endpoints).
- Select endpoints to import.
- Click Create endpoints to complete the process.
By default, all endpoints are activated and available via the API Gateway.
Exposed URL
The URL structure for accessing upstream endpoints via the API Gateway is:
{api-gateway-backend-url}/namespace/upstreamendpointpath
The backend URL is also displayed in the Swagger UI in the Servers section.
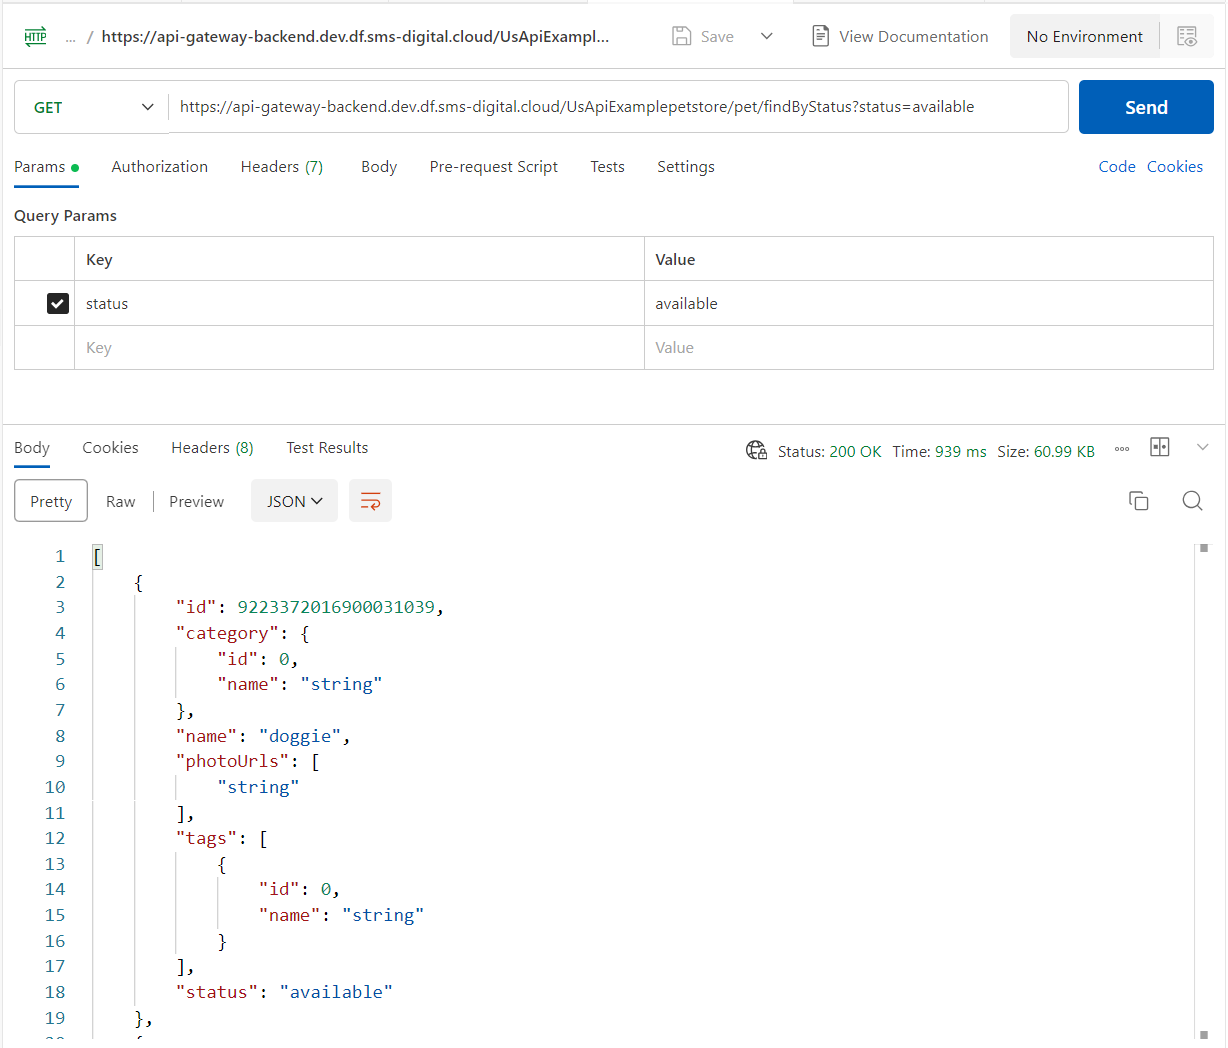
Example: Accessing via Postman
Configuration Import/Export

The export and import features facilitate transferring API Gateway configurations between servers. The configuration includes selected upstream endpoints and all referenced downstream endpoint groups, including mapping and processing information.
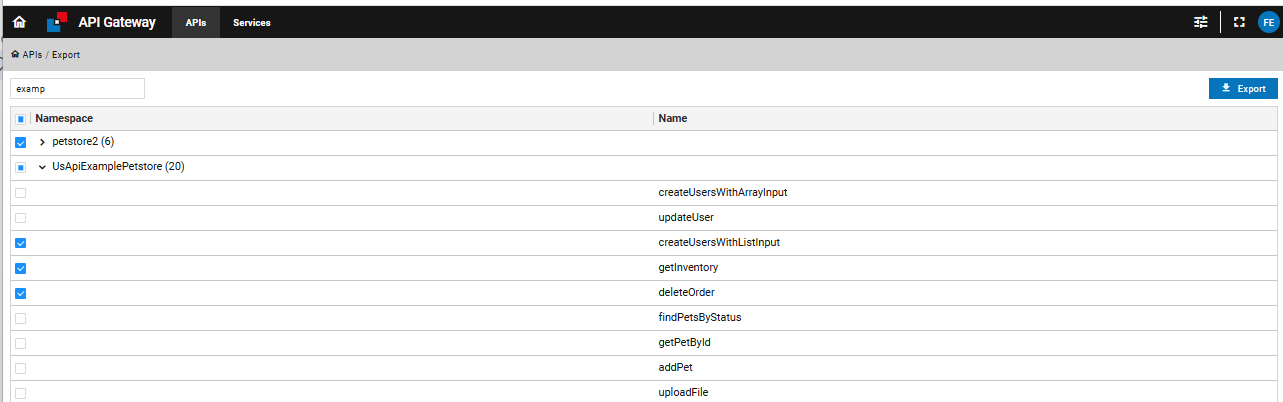
Export
Select upstream endpoints to export. The selection can be made at the namespace or endpoint level. The exported file is saved to the server's local filesystem. Rename the file as needed.
Import
Select a prepared configuration file accessible to the target server. If you encounter duplicate service errors, ensure that configuration transfers are performed in a single file and that the target system is empty.

Processing and Mapping
The Edit link and Create API button open the same dialog. In edit mode, existing data is loaded; in create mode, the form is empty.
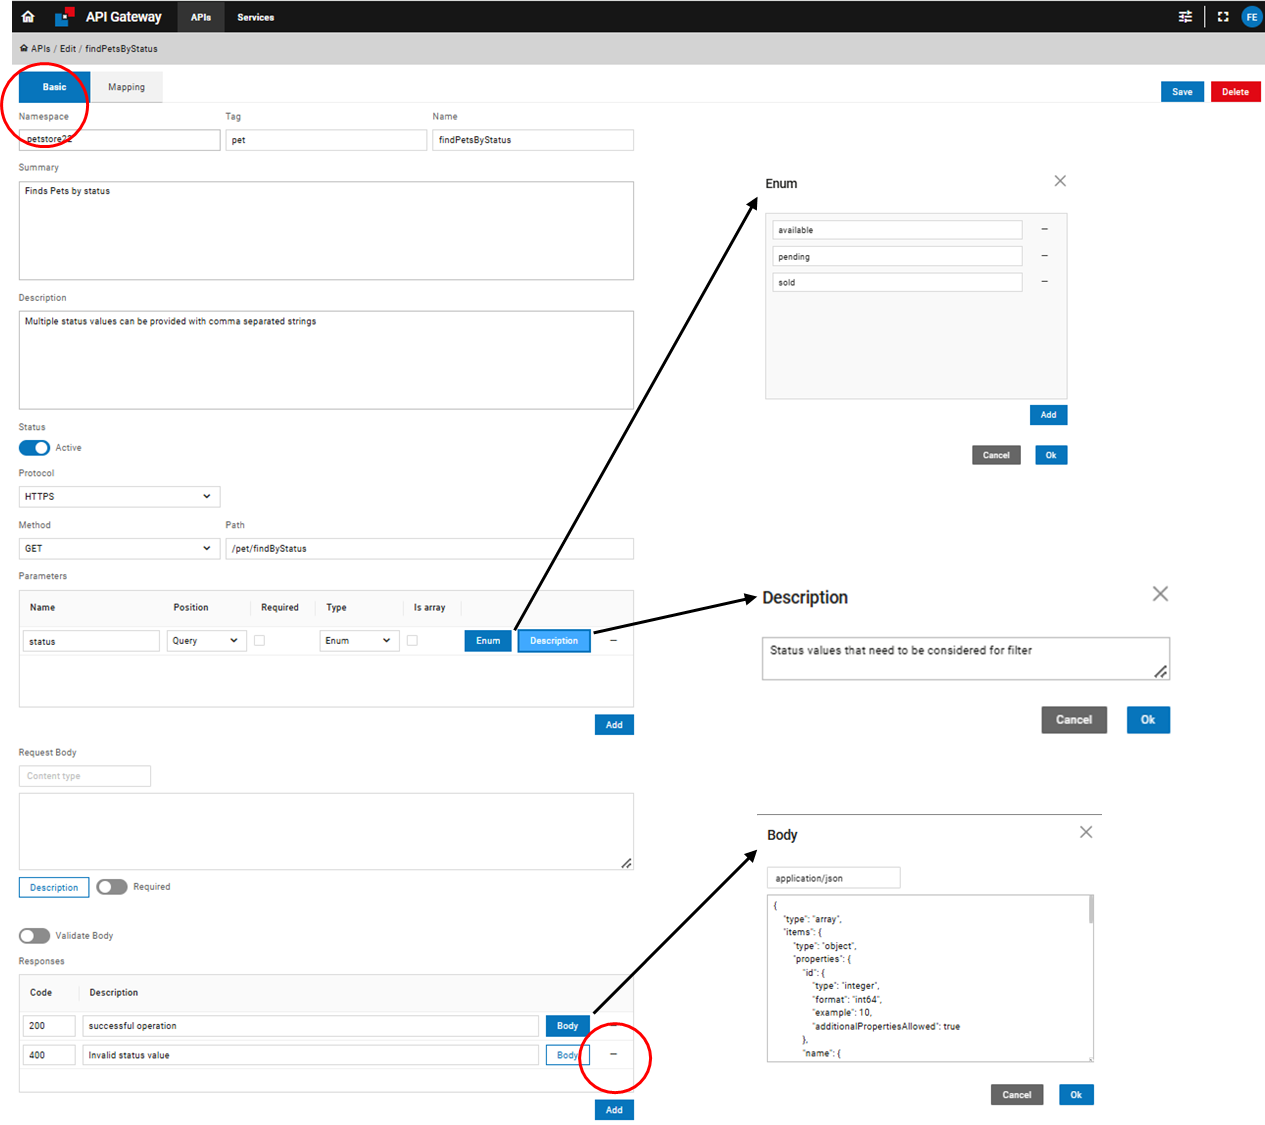
Upstream Endpoint Information
Basic information tab for upstream API details.
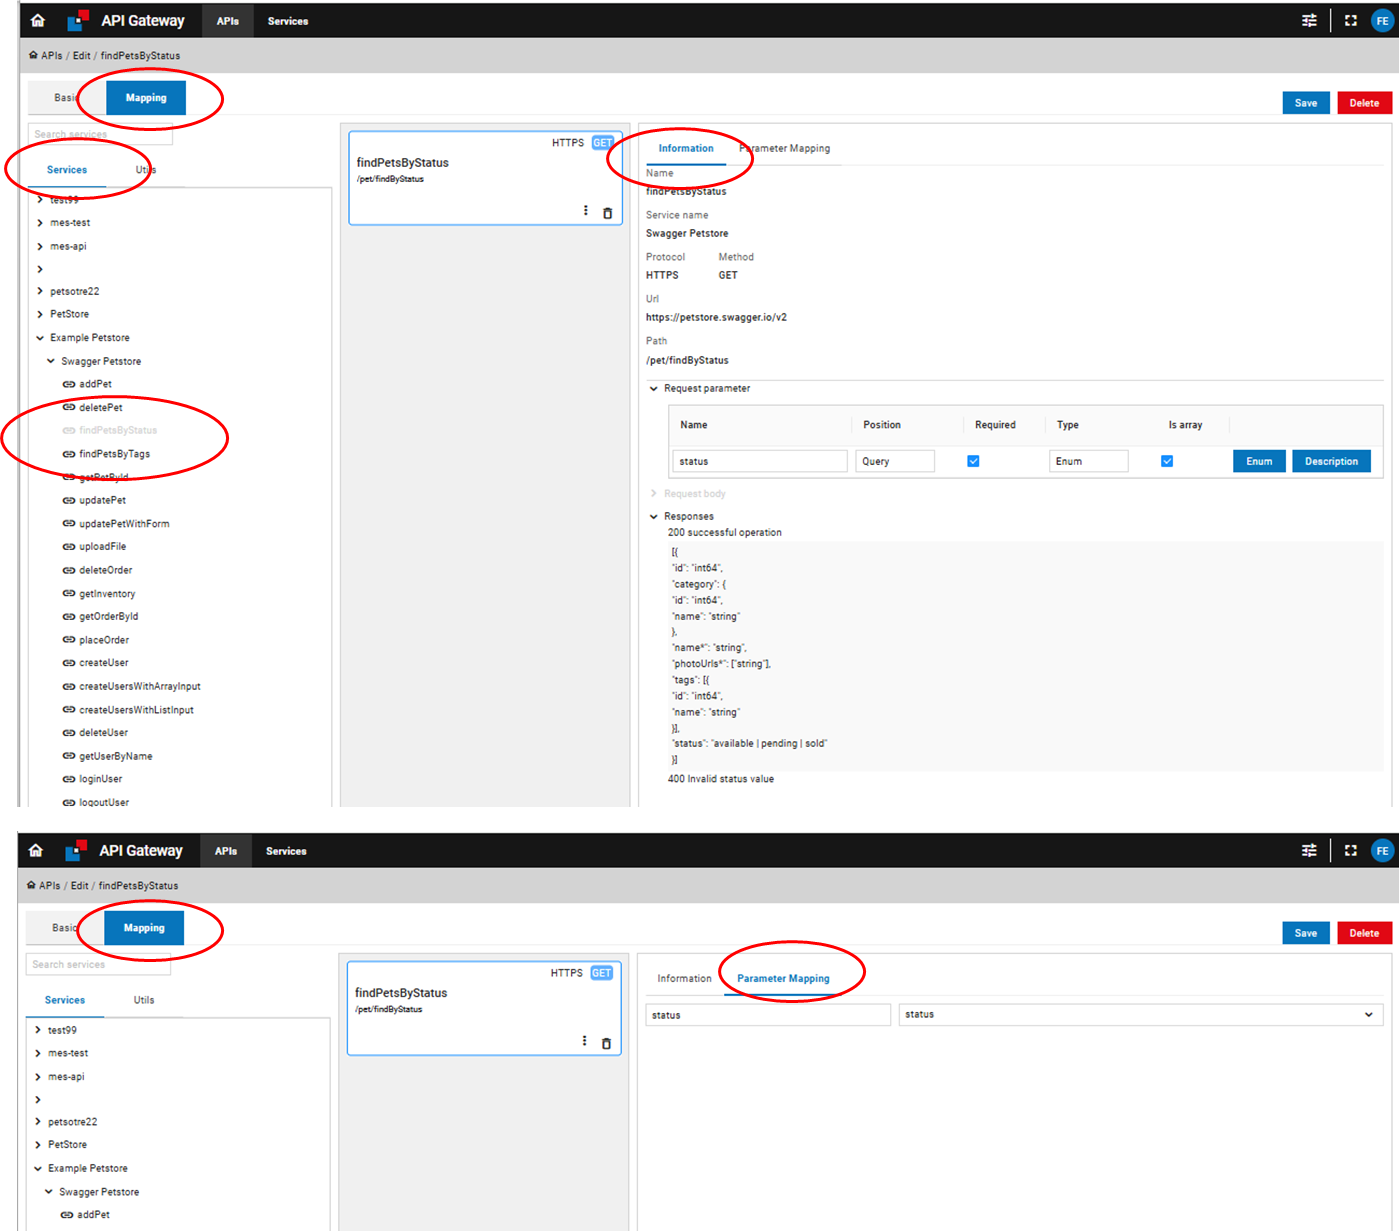
Downstream Service Information
Mapping tab for downstream service information and parameter mapping.
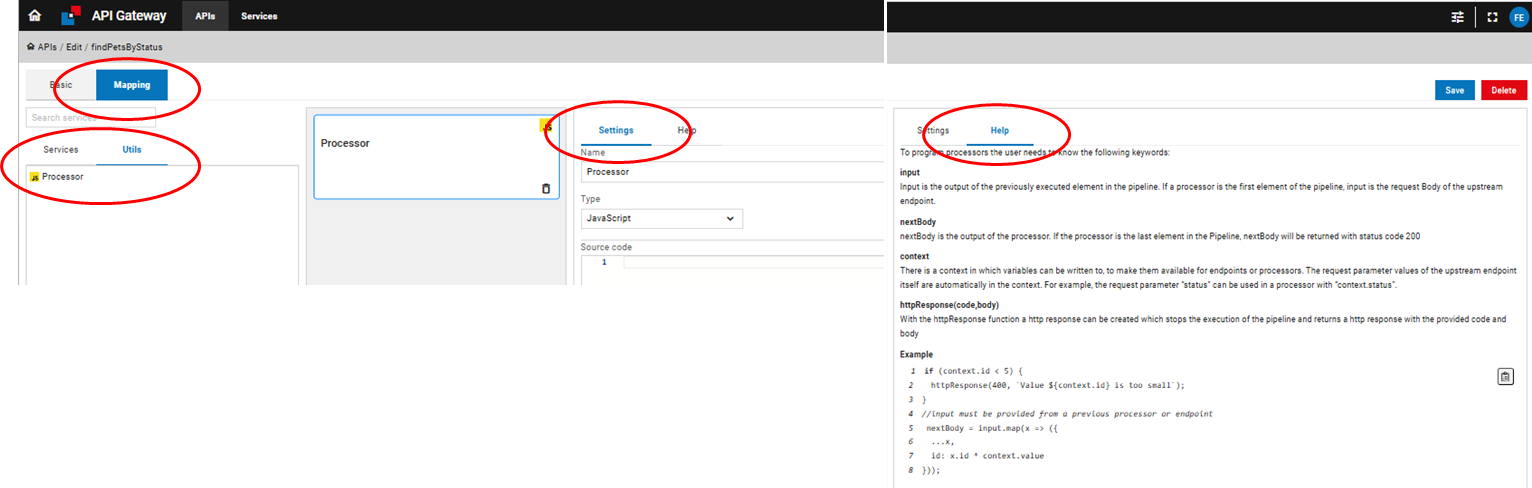
Processor Information
Processor settings and help.
Adjusting a Pipeline
The processing pipeline for an API endpoint can be modified with the following actions:
- Add Processors: New pre- or post-processors can be added to the pipeline via the Overflow Menu ("⋮") on the relevant element or by drag-and-drop from the Utils tab.
- Add Endpoints: Existing endpoints can be added from Services tab by drag-and-drop.
- Move Elements: Endpoints and processors can be rearranged within the pipeline by drag-and-drop.
- Delete Elements: Any pipeline element can be removed by clicking its Delete button.
- Edit Settings: The settings or metadata of a pipeline element can be accessed and modified by clicking on the element.
Pipeline Coding Example
To program processors, use the following keywords:
input: Input is the output of the previously executed element in the pipeline. If a processor is the first element of the pipeline, input is the request body of the upstream endpoint. If an endpoint is used before the processor, the response will be forwarded in this format:
{
  "StatusCode": 200,
  "Content": "...",
  "ContentType": "application/json"
}
nextBody: Output of the processor. If last in the pipeline, returned with status code 200.context: Stores variables accessible to endpoints or processors. Request parameters are automatically available (e.g.,context.status).httpResponse(code, body): Returns an HTTP response
Usage Example:
The findPetsByStatus endpoint is directly connected to the downstream endpoint with the same name. A call returns the backend response unchanged. Adding a post-processor with empty source code results in an empty 200 response. If you want to multiply the ID of each object by a specific value, you can provide this value as a request parameter in the API configuration. The value will then be accessible via the context object within your processor code.
 nextBody = input.Content.map(x => ({
  ...x,
  id: x.id * context.value
}));
Buttons

- Save
Changes can be saved using the save button at any time.
- Delete
Deleting an API-configuration will delete all upstream information connected:
After confirming this warning
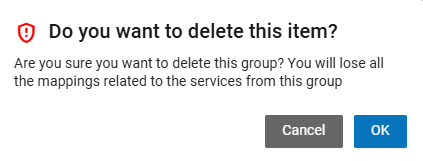
The connected upstream information will be deleted:
- upstream Endpoint information
- pipeline including mapping and processing
The information about the downstream service remains unchanged.
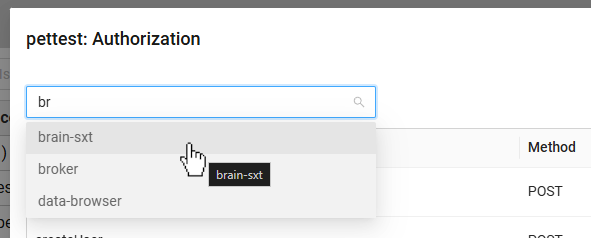
Authorization
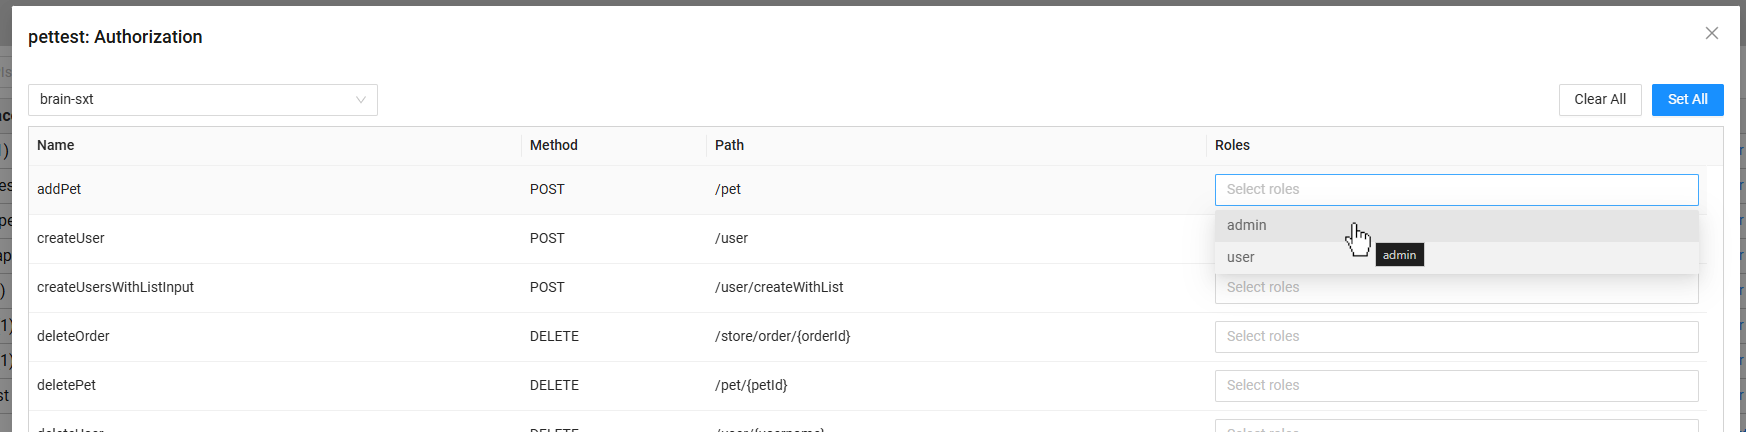
In the authorization modal the user can choose a keycloak client and attach roles to the specific endpoints of the namespace.
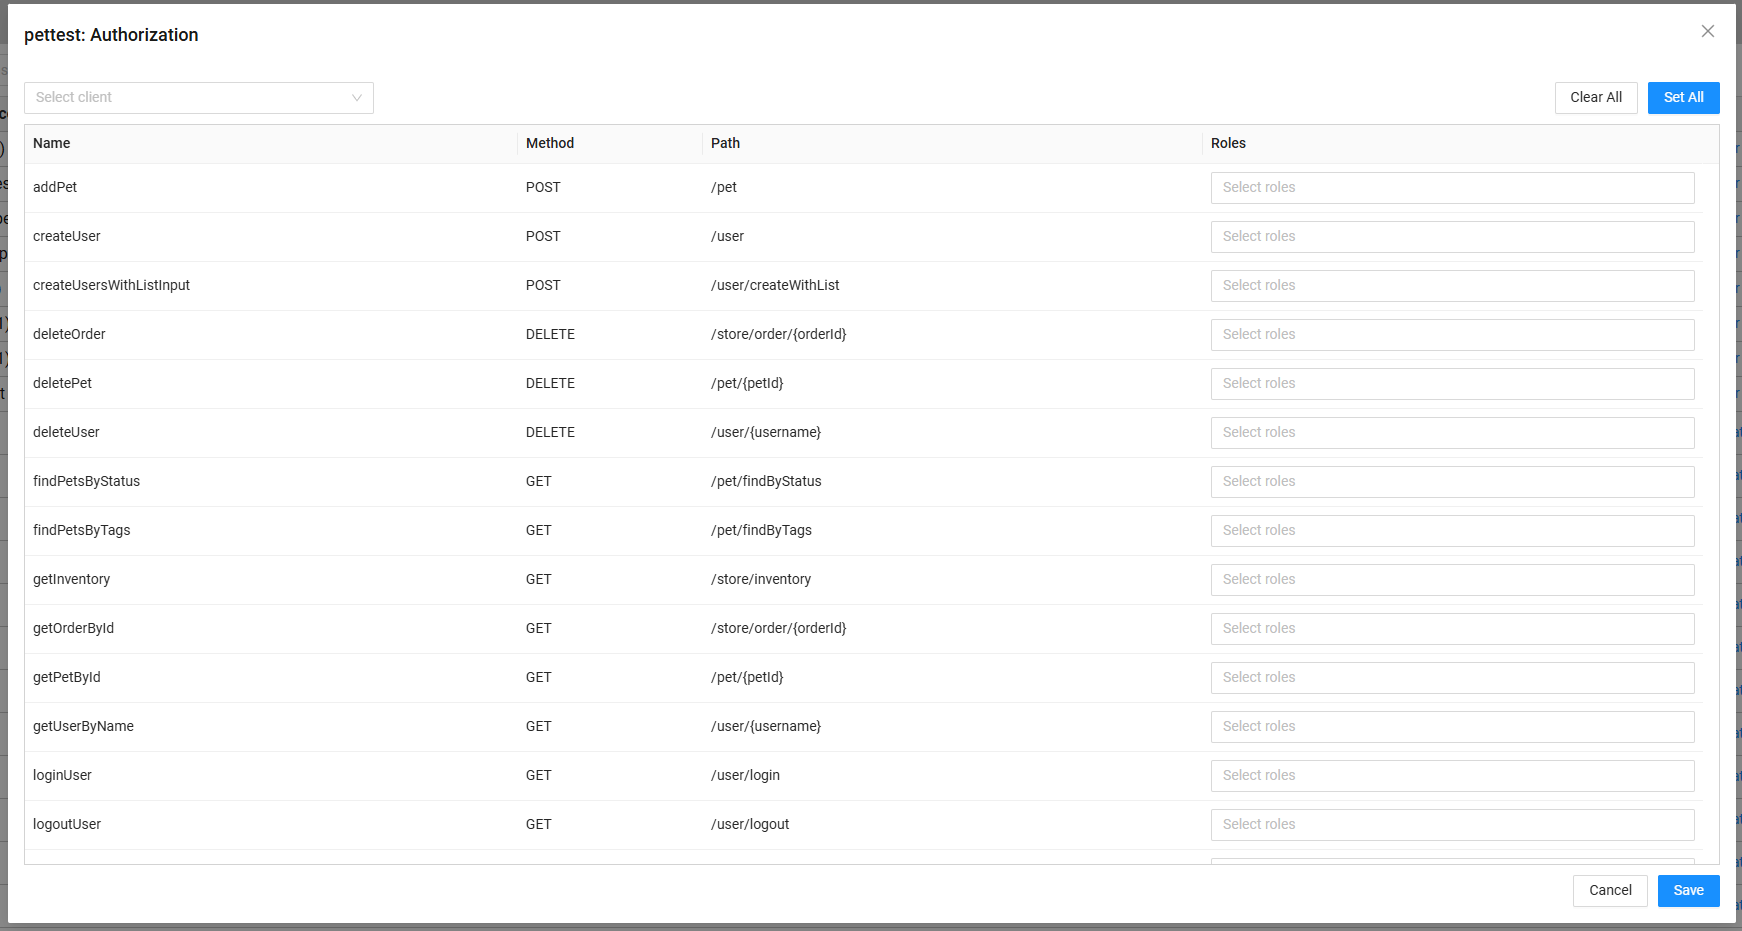
Steps:
- Select a client
- Select a role for each endpoint
- Click Save
If an endpoint is secured, the security icon will be highlighted to indicate its protected status.

Other actions:
- Set All: Let the user select multiple roles which should be attached to all endpoints
- Clear All: Deletes all roles from every endpoint
Tracking
The tracking modal provides an overview of request statistics for each endpoint in the namespace over the last 24 hours.
![]()
Tracking Information
- Name: Endpoint name.
- Method: HTTP method (e.g., GET, POST).
- Path: Route for the endpoint.
- Requests: Total number of requests received.
- Error Rate: Number of failed requests.
- Actions: Monitor button opens the monitoring modal for further analysis.
Monitoring Modal
The monitoring modal displays health and performance metrics for the selected endpoint. For more details, see Downstream Endpoint Health Monitoring.
![]()
The colors of the bars indicate the response status code:
- Green: 100–299 (Success)
- Orange: 300–399 (Redirection)
- Red: 400–599 (Client/Server Error)